Power BI Monitoring

%402x.svg)

Hello!
In today’s article, I would like to talk about checking your most active users across the Power BI service with a real-life example.
Enjoy reading!
How do you check if reports developed across your company are being used?
How do you track who is using your reports?
Are you tracking the most active departments/users?
Have you ever wondered who is performing what type of activities across the Power BI service?
To answer the above questions, let’s assume the following:
To address the above case, we will use the Power BI Monitoring tool built by my company, Astral Forest.
Let’s focus on the “Tops” page. It contains detailed information about users, reports, and workspaces.
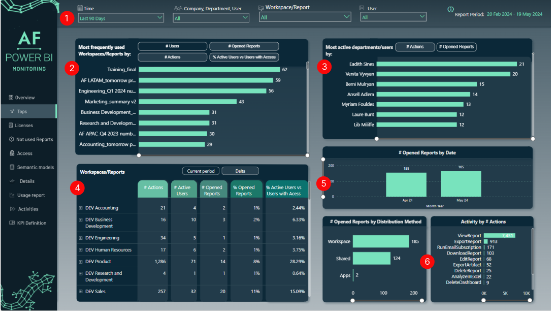
(1) Filters
At the top of the page, you have several filters to select your data:
(2) Most Frequently Used Workspaces / Reports By
Here, you can use a drill down/drill up functionality to navigate between the list of workspaces and reports. Also, analysis can be performed at different levels, depending on selection:
(3) Most Active Departments/Users By
As in the above example, you can use a drill down/drill up functionality to navigate between the list of workspaces and reports. With the correct level selected, you can choose to see data by #Actions or by #Opened Reports:
(4) Workspaces/Reports
Shows the most important KPIs in a compact form with a hierarchy that allows navigation from workspace to report. The table is ready to export into Excel for further actions, if required:
Table 1: Example of Delta calculation
(5) # Opened Reports by Date
Shows the number of opened reports split by date. You can use the drilldown functionality to go from Year → Month → Day.
(6) # Opened Reports by Distribution Method and Activity by # Actions
Summarized visuals show the split of opened reports and actions, respectively.
Additionally, the “Activity by # Actions” visual has drillthrough functionality enabled. With a right-click on any activity bar, you can check the actual usernames, workspace, and report behind each activity.
Step 1: Let’s Check the List of Active Users in the Marketing Department
The first thing I would do as Kate is to find out the list of Marketing department employees using Power BI content. This will help us understand who is using which reports across our company.
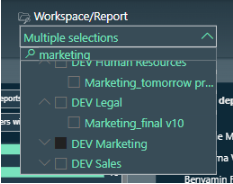
Let’s go to the filter and use a search box with the keyword “marketing”:
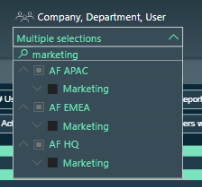
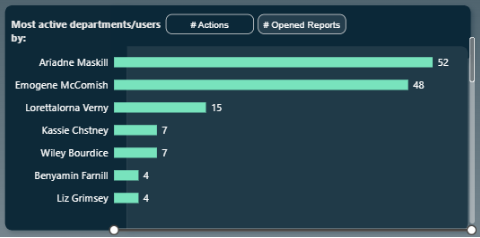
With this, we can see a list of active users in the graph on the right. It is possible to export it into Excel, so we can use the vlookup() function to compare it with any other list we get from the internal HR system. This way, Kate can cross-check if her list is valid or missing any of the names below:
Also, with this department filter selected, we can review the “Most frequently used Workspaces/Reports by” visual to check what Power BI content is being used:
As you can see on that screen, Marketing employees are looking at various reports from various departments. This can be one of the main points for Kate’s further analysis. She should investigate what is required or important from a business perspective. Perhaps there is a way to consolidate some of the measures and provide sufficient information in Marketing-related reports.
Also, please note that the top workspace by the number of # Users is “PW Candida Stuffins.” PW stands for Personal Workspace. From a Power BI service health point of view, it might be worth reviewing this content and considering cooperation between the IT department responsible for Power BI reporting and Candida Stuffins.
Important: We are currently checking the active Marketing employees only. It might not be the full list of all Marketing employees, as the Tops page focuses on actions and activities. Let’s first talk with the people who are actively using Power BI. In the future, we could gather requirements from inactive users. In many scenarios, there are always some Excel or ad-hoc reports just waiting to be converted into company standard Power BI reports.
Step 2: Find All Users of Marketing Workspaces Content
Let’s filter the “Tops” page by DEV, UAT, and PROD Marketing-related workspaces. For this, we can use a search filter with the keyword “marketing.” As you can see in the screen below, even when filtered by “marketing,” we can see other workspaces as well. If we expand to a lower level, we can see Marketing-related reports in workspaces like Legal or Human Resources! This is one way to validate if our Power BI environment is clean.
For the purpose of this scenario, let’s assume we have Marketing-related reports only in Marketing workspaces. Here is the filter:
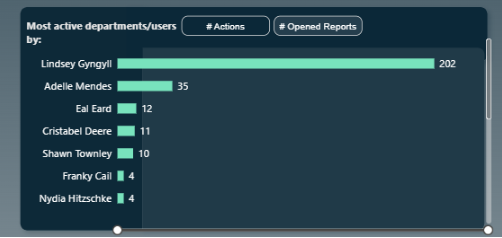
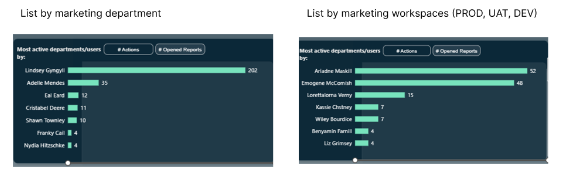
Let’s check active users as per marketing workspaces:
As you can see, the above list shows entirely different names when filtered by workspace compared to when filtered by Marketing department.
This is definitely a reason for investigation. In a perfect world, the Marketing department and Marketing workspaces should have more or less similar user names:
Action for Kate: Investigate both lists and check why there are so many differences.
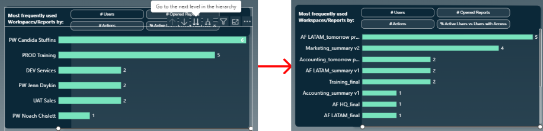
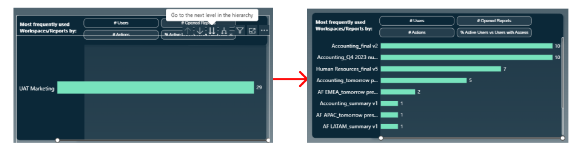
Here, you can see the list of workspaces/reports selected by the filter. As you can see, reports from different departments are stored in UAT Marketing workspace!
What worries me is that PROD Marketing workspace is missing in the picture on the left. It means that currently, everyone is using only the UAT Marketing workspace! Another health check for our Power BI service team:
Step 3: Compare Marketing Employees List, Gather Requirements, and Build Power BI Marketing Reports Plus Workspace Cleaning Exercise
Now, Kate has all the information she needs:
Additionally, we can compare the above lists with the initial Marketing employees list from the assumptions to check for any gaps or missing names.
We also found out that report content might be mixed across different workspaces.
The next step might be to perform individual interviews, organize calls, and conduct workshops to address all the challenges and requirements across the Marketing content provided by Power BI service reports.
Sounds like a lot of work ahead!
Well, that’s it for today!
I hope you enjoyed our explanation!
With our tool and a few clicks here or there, we managed to:
These findings open new opportunities and challenges, such as:
In case of any questions, don’t hesitate to reach out to us! We are more than happy to discuss Power BI and our product in further detail!