Power BI Monitoring

%402x.svg)

Hello!
In today’s article I would like to talk about Power BI licensing costs and how you can check whether you overpay.
Enjoy reading!
Did you ever wondered if your Power BI licensing management is cost efficient? How do you check and manage amount of licenses per user?
In this article I would like to focus on one of the common Power BI setups. Which is:
Main goals behind this exercise are:
Ok, for purpose of this article let’s assume:
To address above case, we will use Power BI Monitoring tool, built by my company, Astral Forest.
Let’s focus on the “licenses” page. It contains detailed information about licensing, users and activity.
Picture 1: Licenses PBI monitoring page
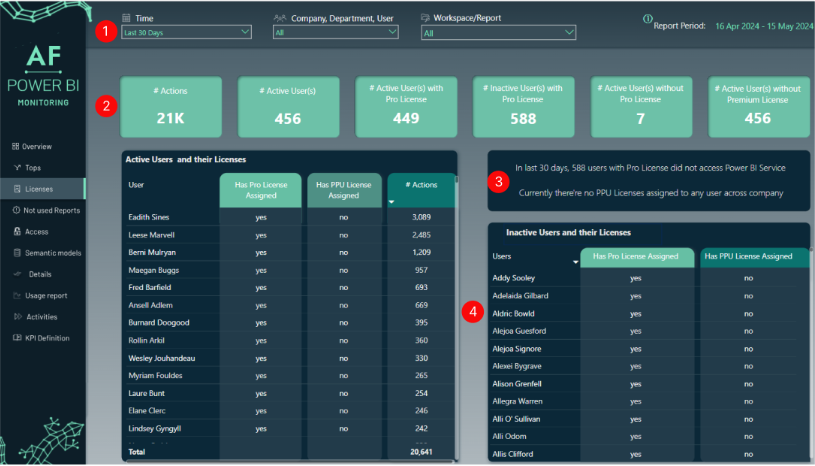
(1) Filters
On top of the page you have a couple of filters to select your data:
(2) KPI’s
Regarding numbers, we focus on:
(3) Dynamic text
Based on slicer selection there is information visible, which can be useful for presentations or quick glimpse of an eye. As PPU licensing is not the most common, we also check whether there are any PPU licenses at all.
(4) Tables with detailed data
These 2 tables show your employees with licenses assigned and actions performed. Each table is ready to be exported into Excel for further investigation and checks.
Now, that we have basic understanding of the “Licenses” page, let’s address our scenario.
Step 1: retention policy
Let’s first agree on our retention policy. When and how can we tell if a person does not need a license anymore? Obvious reason is if someone changes work, department or responsibilities.
But what if we have employees with a license, which is not used? Some usage can be on a monthly, quarterly or even annual basis. This is actually a common case. A high-level manager might be interested only in checking annual numbers.
If this is the case, let’s check our time periods (we definitely don’t want to remove a license that is used on a periodic basis!). Currently, we have the following options:
Picture 2: Time periods
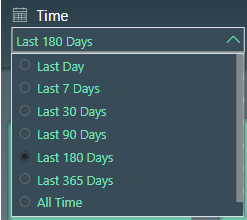
Important: When you start to use our tool, you need to build history. So after 365 days, you will see a difference between “last 365 days” and “all time”. It is possible though to add more granularity if required. Feel free to reach out to us and we are happy to discuss.
As per assumption, let’s focus on a period longer than 90 days:
Picture 3: Longer than 90 days
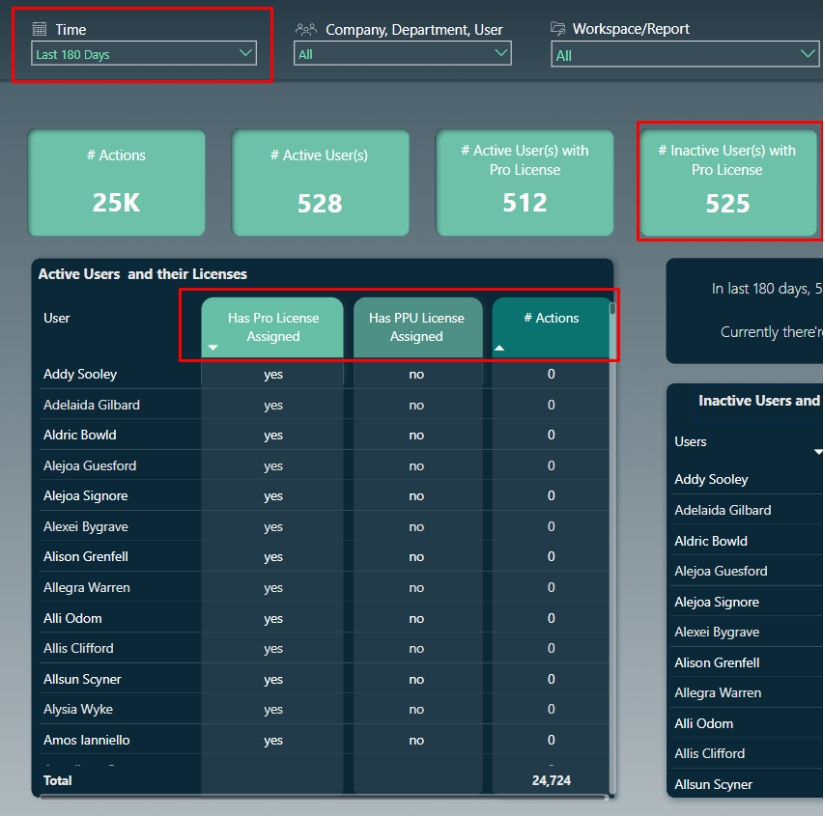
I selected “Last 180 days” period, I can see there are 525 inactive user(s) in that period.
Also, if I sort multiple columns in the table, I can see specific users with no action (sorting by multiple columns in Power BI is possible by default with holding left shift + left mouse button click).
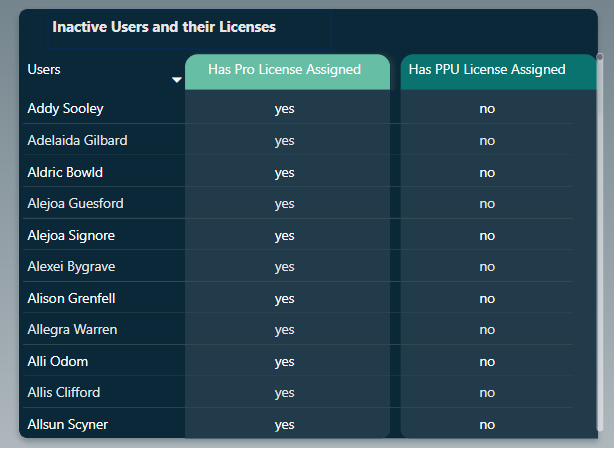
Or you can simply navigate to the second table if you don’t need to check actions at all:
Picture 4: Inactive users as per filter context
Step 2: take appropriate action
What shall we do with licenses assigned to inactive users? I don’t recommend removing any license as the first reaction! Unless, you are sure there are some employees who left and the license is simply hanging in the system charging you every month.
My recommendation would be to at least reach out to these users. Start a dialog, understand what’s going on. In some cases you might find opportunities and challenges regarding Power BI content produced within the company.
For instance, I have heard many scenarios where end-users dropped Power BI reports made by IT for ad-hoc made Excel files and reporting.
Back to our case:
Step 3: Refresh Power BI Monitoring
Last step would be to check if report was updated based on newest actions of course! Report can be set to schedule refresh, along with the backend solution beneath (SQL database and calling Graph/Power BI API).
Well, that’s it for today!
I hope you enjoyed!
With our tool and a few clicks here or there, we managed to:
If you would like to talk and check different Power BI licensing setups, reach out to us or check official Microsoft documentation. There’s plenty of info! We are more than happy to talk about Power BI and our product!